
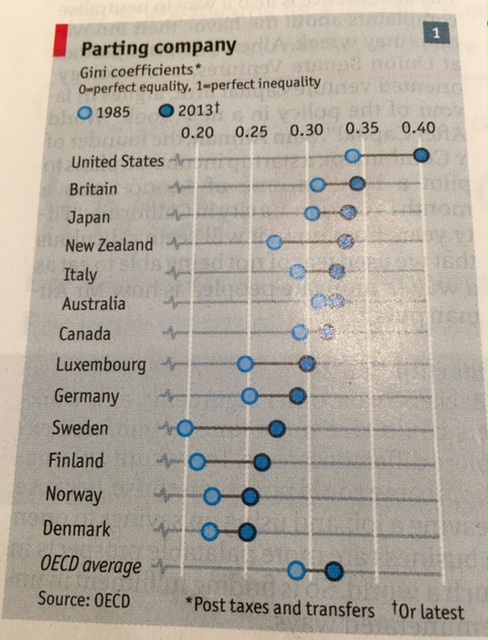
Latest issue of the Economist features a discussion on State stipends , but what caught my eye is a table of Gini Coefficients and changes from 1985 to 2013.
Not surprising, inequality is the trend. If Sweden was more equal 30 years ago (around 0.2), it is now 0.28. Better than OECD average, but definitely a decline.
Notice that the trend is uniform as well as the OECD average. Japan, which was considered a rather “equal” country, is NOT. And even a bit worse than the average.
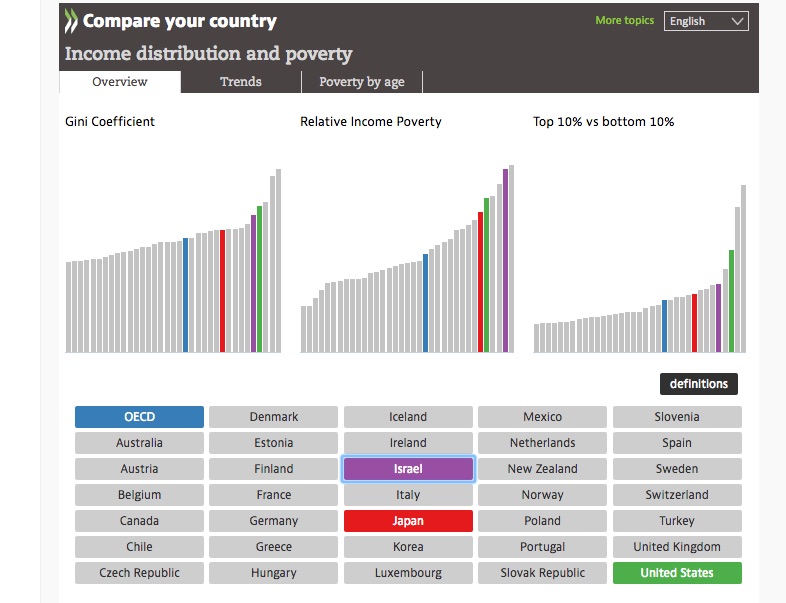
Digging into additional (old) OECD numbers , show the same trends, with Israel being even worse than Japan, and not much better than the US.
Is there something I can do about this ? Probably not, but let me think some more.